

Audit logging is available only for Pro and Enterprise plans.
Accessing Audit Logs
GUI
Workspace Admin or DBA can access audit logs through the Bytebase console:- Navigate to the Settings page
- Select Audit Log from the sidebar
- View the chronological list of all audit events
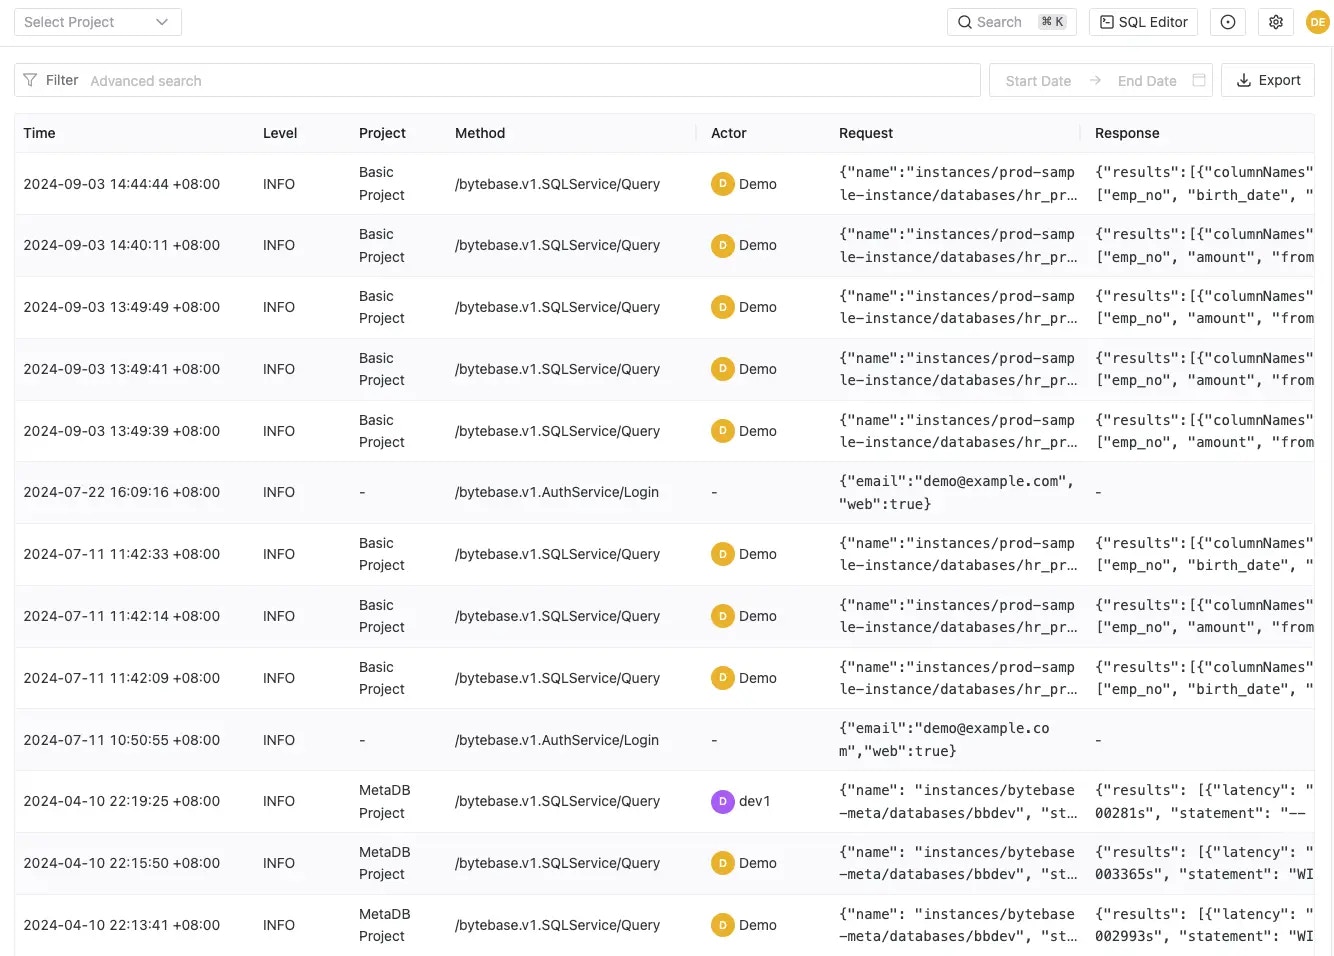
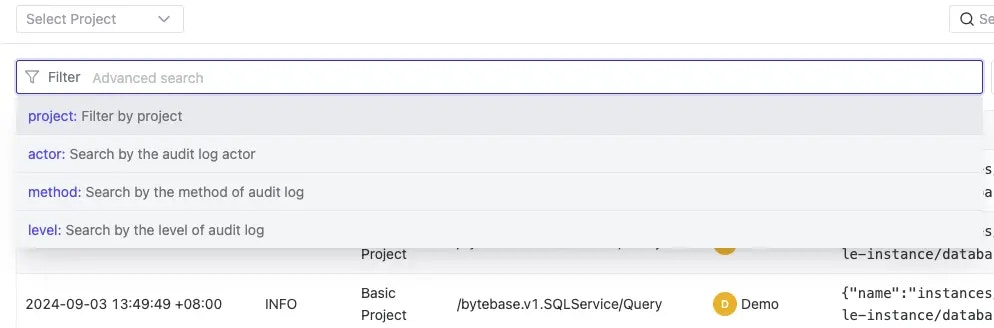
- Actor: the account that performed the action
- Method: the API method called
- Level: the log severity
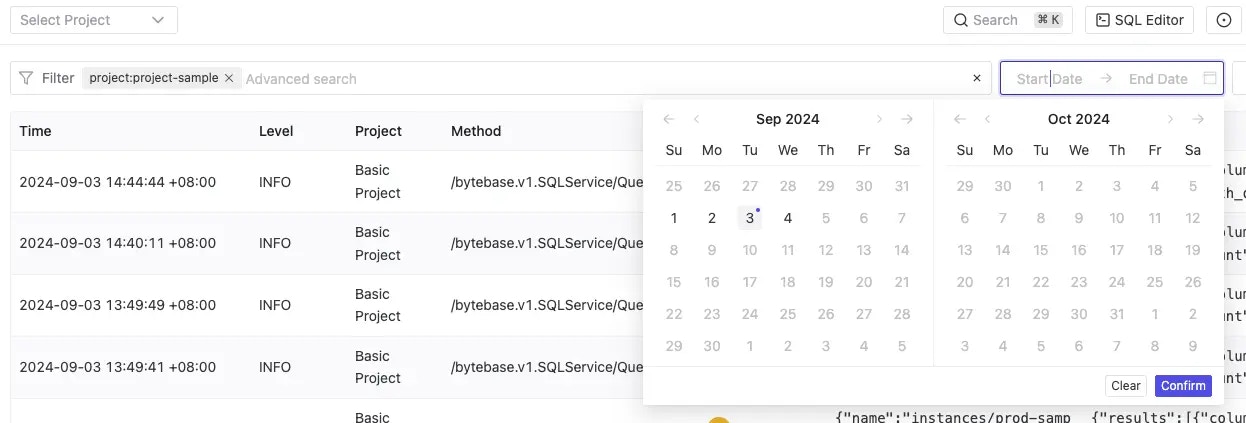
- Time range
API
Use the Bytebase API to programmatically access audit logs for integration with external systems and automated monitoring.Streaming
Stream audit logs to external logging and monitoring systems for centralized management. It supports JSON format output in addition to the default text format.- Navigate to Settings → General → Audit Log Export
- Enable Enable audit logging to stdout
- Save the configuration
--enable-json-logging flag:
- SIEM Platforms: e.g., Splunk, Datadog, Elastic Security
- Log Aggregators: e.g., Fluentd, Logstash, Grafana Loki
- Cloud Services: e.g., AWS CloudWatch, Google Cloud Logging, Azure Monitor
Log Structure
Example Entry
Payload Fields
Severity Levels
Status Codes
Status codes follow gRPC conventions:Audited Events
Authentication
Authentication
Notes:
- Sensitive fields redacted:
password,otpCode,recoveryCode,mfaTempToken,idpContext - MFA phase logs extract user email from MFA temp token when email is not in request
User Management
User Management
Notes:
- User responses redacted to only include:
name,email,title,userType
Group Management
Group Management
Role Management
Role Management
Identity Provider (SSO)
Identity Provider (SSO)
Project Management
Project Management
Notes:
- IAM policy changes include
serviceDatawithPolicyDeltashowing added/removed bindings
Workspace IAM
Workspace IAM
Notes:
- Includes
serviceDatawithPolicyDeltashowing added/removed bindings
Instance Management
Instance Management
Notes:
- DataSource sensitive fields redacted:
password,sslCa,sslCert,sslKey,sshPassword,sshPrivateKey,authenticationPrivateKey,externalSecret,saslConfig.krbConfig.keytab,masterPassword
Database Management
Database Management
Database Groups
Database Groups
SQL Operations
SQL Operations
Notes:
- Response rows completely redacted - only metadata captured:
columnNames,columnTypeNames,rowsCount,error,latency,statement - Each request/response pair in streaming operations generates a separate audit log
- Export request
passwordfield redacted; responsecontentnot logged
Issue Management
Issue Management
Plan & Rollout
Plan & Rollout
Policy & Settings
Policy & Settings
Events Not Logged
Retention
Audit logs are stored in theaudit_log table in the Bytebase metadata database.
Recommended retention periods:
- Minimum: 90 days
- Compliance environments: 6–12 months
- Manually delete old logs from the
audit_logtable - Set up a scheduled job using
pg_cronor system cron - Export logs to external log management or SIEM systems for longer-term retention
Limitations
Privacy and Security
- Query results excluded: Actual row data from queries is redacted
- Sensitive data masking: Passwords, API keys, SSL certificates, SSH keys automatically replaced with masked values
- Response truncation: Large response payloads may be omitted
Technical Constraints
- Synchronous generation: Audit logs are generated during request processing
- Pagination limit: Maximum 5,000 entries per API call
- Filter complexity: Searches must use valid CEL expressions
- Storage: Logs stored in metadata database, following its retention policies